MGTEK TraceView Plus 3
Analyze Windows WPP/ETW traces in seconds
- Drop-in replacement for Microsoft TraceView
- View live traces or pre-recorded traces
- Powerful filtering engine with color highlighting
- Full support for WPP Software Tracing
- One-click trace sessions from PDB, TMF, or TMC files
- Support for 'Jump to Code' in Visual Studio
Introducing TraceView Plus
TraceView Plus is a fast and light-weight trace viewer designed for WPP Software Tracing and DbgPrint. WPP Software Tracing is a tracing technology from Microsoft primarily intended for debugging code during C/C++ development. With TraceView Plus you can create and view traces, and analyze them quickly.
Still using log files?
If you have not used Microsoft's WPP Software Tracing before, you definitely need to give it a try. Build upon the powerful Event Tracing for Windows (ETW) architecture, there is no technology that can deliver similar features and performance.
If you are new to Windows Event Tracing and WPP, click here to learn more.
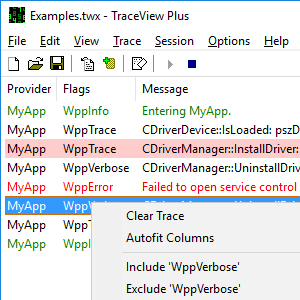
Powerful filtering engine with color highlighting
When you create trace sessions, it is not unusual that thousands of trace messages are generated. In order to be able to quickly extract information from the trace, you will need to filter the trace records and highlight important information. With TraceView Plus, you have the necessary filter capabilities at your fingertips: You can define a list of include and exclude rules, with simply pattern matching or regular expression syntax. The sample filtering engine can be used to highlight specific trace records. You can specify up to ten filter sets that can be quickly selected with a keyboard shortcut, depending on the view you need.
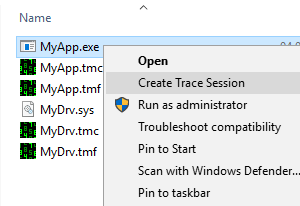
One-click trace sessions
Creating trace sessions could not get any easier with TraceView Plus. You can create trace sessions by simply double-clicking .pdb files,.exe or .dll files, or by opening a TraceView Plus project file. If your .pdb file changes because you have recompiled your application, you can have TraceView Plus automatically reload the .pdb file. Alternatively, you can specify the provider GUID, and TraceView Plus will automatically locate the proper .pdb files.
Feature Summary
Trace management
- Full support for real-time sessions and .etl log files
- One-click trace sessions from PDB or EXE files
- Trace provider management supporting multiple providers with individual level and flags settings
- Trace provider import from PDB, TMC, CTL, or manifest files
- Trace format import from PDB, TMF, or manifest files, including TMF search path support
- Supports debug events (RSDS) on Windows 8 or later for automatic PDB discovery
- Supports C/C++ TraceLogging events using embedded metadata
- Supports capturing local DbgPrint/DbgPrintEx/KdPrint/KdPrintEx output
- Supports Microsoft Symbol Server for automatic PDB discovery and loading
- Supports .NET System.Diagnostics.Tracing.EventSource with Strongly Typed Events based on embedded manifest files (EasyETW)
Usability Features
- Project files for instant setup
- Full-text search with regular expressions
- Powerful filtering engine based on include/exclude rules
- Rich coloring and highlighting capabilities
- Marker for quick search and coloring
- 'Jump to Source' jumps to trace statements in Microsoft Visual
- Automatic reload of changed PDB files after project rebuilds
- Miscellaneous goodies such as file association, drag-and-drop support, resizable windows, QHD display support, text export via clipboard, etc.
System Requirements
Supported operating systems
- Windows 10 (32-bit and 64-bit)
- Windows 8 (32-bit and 64-bit)
- Windows 7 (32-bit and 64-bit)
- Windows Vista (32-bit)
- Windows XP SP2 or higher (32-bit)
Additional requirements
- Windows XP requires Debugging Tools for Windows installed (includes dbghelp.dll)
Ready to increase your productivity?
If you would like to try TraceView Plus, we are pleased to provide you with a free evaluation version:
Trial Software Limitations
- 30-days time limit
- Nag Screen
Other Downloads
TraceView_3_0_1924_x86.msi, V3.0.1924
TraceView_3_0_1924_x64.msi, V3.0.1924